Debugging your Wowza Module from Eclipse
·When you are developing a custom Wowza Streaming Engine® module, you might want to be able to debug your code using Eclipse’s feature-rich debugger features. This tutorial shows you how to modify the Wowza startup script to enable debugging in the JVM and how to attach the Eclipse’s debugger to Wowza. (Did you already set up your environment to start Wowza module development?)
Java debugging works by first switching the feature on in the JVM, then enabling one of debugger attachment interfaces and finally attaching the debugger to that interface. I’ll show you how to do this in this case.
Enabling debug in the JVM under Wowza
Find and edit the Wowza startup script, on Windows this is called startup.bat. You’ll need to find the line where the JVM is effectively launched, and edit according to the below snippet:
This is the original line:
%_EXESERVER% "%_EXECJAVA%" %WMSTUNE_OPTS% %JMXOPTIONS% -Dcom.wowza.wms.runmode="%runmode%" -Dcom.wowza.wms.native.base="win" -Dcom.wowza.wms.ConfigURL="%WMSCONFIG_URL%" -cp %CLASSPATH% com.wowza.wms.bootstrap.Bootstrap start
Change this by adding the -Xdebug -Xrunjdwp:transport=dt_socket,server=y,suspend=n,address=1044 parameters:
%_EXESERVER% "%_EXECJAVA%" %WMSTUNE_OPTS% %JMXOPTIONS% -Dcom.wowza.wms.runmode="%runmode%" -Dcom.wowza.wms.native.base="win" -Dcom.wowza.wms.ConfigURL="%WMSCONFIG_URL%" -cp %CLASSPATH% -Xdebug -Xrunjdwp:transport=dt_socket,server=y,suspend=n,address=1044 com.wowza.wms.bootstrap.Bootstrap start
-Xdebug switches debug mode on in the JVM, the other arguments set the debugger as a server, which won’t suspend the JVM on startup, but which is going to be listening on port 1044 for incoming debuggers.
Now start your Wowza server with this, and you should see this in the logs:
Listening for transport dt_socket at address: 1044
Configure logging: file:///w:/wowza-4.0.3/conf/log4j.properties
INFO server server-start Wowza Streaming Engine 4 Developer Edition (Expires: dec. 24, 2014) 4.0.3 build10989 -
INFO server comment - Server License Key: EDEV4-XXXXX-XXXXX-XXXXX-XXXXX-XXXXX
Create a Debug configuration in Eclipse
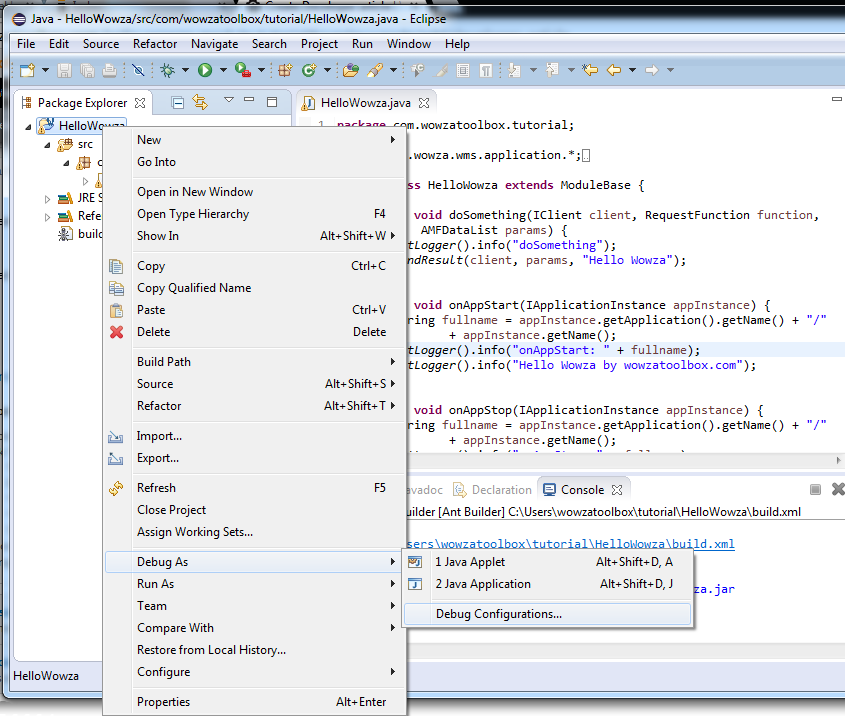
Right-click on the HelloWowza project in the Package Explorer view and select Debug As.. > Debug Configurations..
On the opened dialog, create a new “Remote Java Application” type debug configuration, by choosing this from the lefthandside list and click on the small icon with a blank sheet and a small plus sign. The Connection Type should be “Standard (Socket Attach)” and Host should be “localhost” and port should be 1044. (Actually you can remote debug your remote Wowza server too, if you like, not only localhost). Click “Debug” when you’re done.

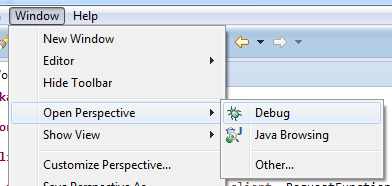
Navigate to the “Debug Perspective”, unless it opened up automatically when the debugger attached successfully.
Now you should see that the Eclipse debugger is attached to the JVM which runs Wowza Streaming Engine. You should see the threads inside all running.

Now insert a breakpoint into any code line by double-clicking on the left margin. In this case I inserted one on line 26, which is in onAppStart. I chose this, as when I start pushing my live stream from Flash Media Live Encoder, I know that my application will be started automatically by Wowza and so the debugger should stop the show at my breakpoint. I started the stream and the magic happened, as you can see on the above screenshot, the debugging just works.. :-)
From this point, you can leverage conditonal breakpoints or anything that you like to develop your custom Wowza module. Read this if you are interested in setting up Eclipse for Wowza module development.